India Says It’s Growing 7.8%. Here’s What They’re Not Telling You
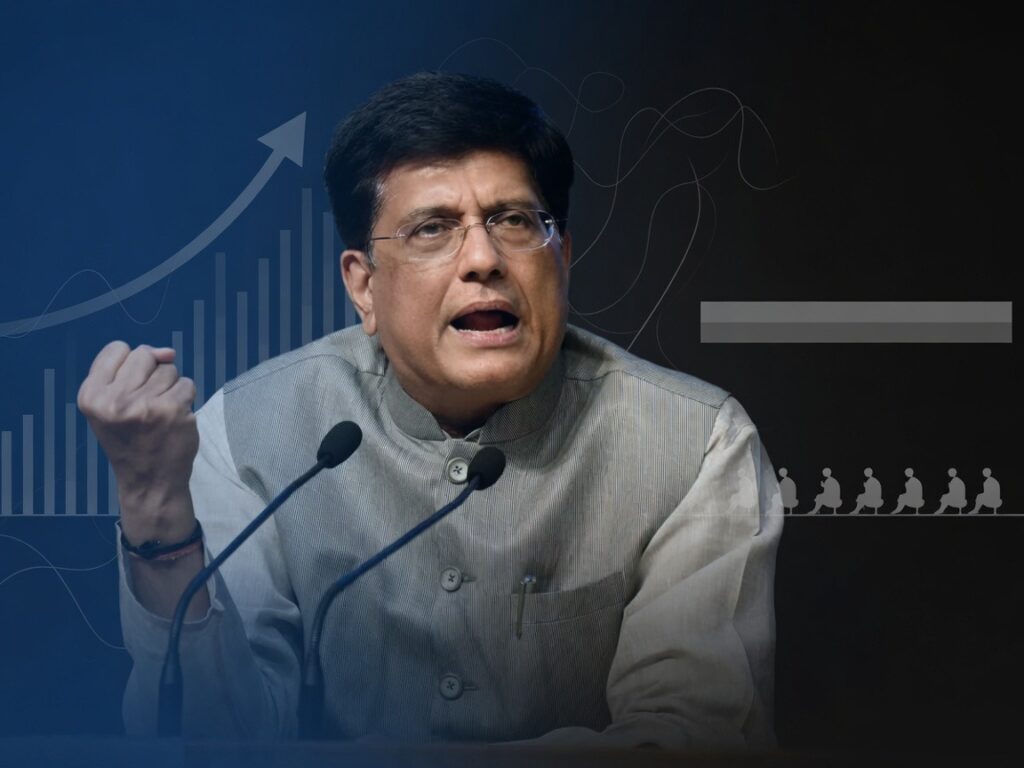
New Delhi: Send me 100,000 people in Tirupur. Piyush Goyal was not bargaining when he said it. Every one of them we will skill and give a job, the minister promised, holding up the textile town as living proof that businesses cannot find enough workers. Then came the swipe at his critics. The people who doubt India’s 7.8% growth are, he said, “the only jobless people left,” their remaining job to sit on TV panels and “concoct or manufacture an argument.”
A day earlier, former RBI governor Raghuram Rajan had asked the question India is now fighting over: are these growth numbers real?
For most people this looks like a shouting match between the government and its critics. It is actually three quieter arguments stacked inside one loud one. One is about statistics: is the new way India counts GDP trustworthy? The second is about the economy: is 7.8% growth real? The third is about people: even if it is real, why aren’t enough good jobs coming with it?
To make sense of it, you don’t need an economics degree. You need one story about a family’s shopping list.

What actually happened
On August 31, the National Statistics Office said India’s economy grew 7.8% between April and June 2026, the first quarter of this financial year. The number beat the Reserve Bank’s forecast of about 7% and surprised nearly every private forecaster. It was a clear jump from the 6.9% of the same quarter a year earlier, though a step down from 8.6% at the start of the year. India has reported similarly strong figures before, including the 7.7% growth IndianYug examined earlier this year.
Here is the key point. Almost nobody serious disputes that India is growing fast. The fight was never about whether 7.8% is high. It is about what sits underneath it.
| What India reported, Q1 FY27 | |
|---|---|
| GDP growth | 7.8% (RBI expected ~7%) |
| Real GVA growth (output before taxes) | 8.2% |
| Industrial production growth | 5.7% (up from 3.8%) |
| Electricity demand growth | 8.4% (up from 1.9%) |
| New passenger car sales growth | 25.6% (up from 13.1%) |
| Centre’s capital spending growth | 18.6% (up from 9.1%) |
| Services business activity index | 58.6 (above 50 = expanding) |
Source: MoSPI GDP release, Aug 31 2026; Economic Times analysis
Read together, these say real activity, not just paper numbers, is picking up. Factories ran more, power use jumped, people bought more cars, the government spent more on roads and bridges. That is what “growth is real” is supposed to look like.
One caution before leaning on them too hard, and it is the same caution this whole story rests on: these indicators carry base effects of their own. Electricity demand surged partly because April to June was fiercely hot and the previous year’s figure was unusually weak. Car sales jumped partly on new model launches and a soft comparison base. They corroborate the headline, but they are not fully independent proof of it.
Why India quietly changed its ruler
Growth is not a simple thing to measure, because money itself is not stable. If your income rises 10% in a year but everything you buy also costs 10% more, you have not really grown at all. So statisticians strip out the effect of rising prices. To do that, they need a fixed reference year, called the base year. For twelve years, India measured its GDP against the prices of 2011-12. In February this year, it switched that ruler to 2022-23.
Here is the layman’s version.
Think of a family and how you would judge whether they are better off. To be fair, you would keep prices frozen at one year’s levels and watch how their buying changes over time.
Now imagine that family in 2011-12. Back then most of their money went on rice, dal and phone calls. The internet was a small line item. Jump to 2022-23. The same family now spends far less of its income on rice and dal, and a fat chunk on mobile data, streaming and online shopping.
Now suppose that over those ten years the price of rice doubled, while the price of mobile data fell by a third. If you measure the family’s real progress using the old 2011 list, where rice is a huge item, that doubling looks like ferocious inflation that swallows most of their apparent gain. Measure with the 2022 list, where cheap data now dominates, and inflation looks mild, so the same family looks like it grew much faster.
Same family. Same real life. Two different results, depending purely on which shopping list you hold up.
That is what a base-year change does. India is not cooking its books. It changed the measuring stick. This is exactly why a 7.8% under the new ruler cannot be slapped next to an older number and compared directly. It is the apples-and-oranges point Goyal keeps making, and here the technical record supports him: statisticians themselves caution against reading two growth rates measured against different base years as a straight comparison.
The honest comparison must wait until December, when the government redoes the old years under the new method, a recalculated history called the back series.
The change made India look smaller, not bigger
Here is a fact that quietly kills the loudest conspiracy theory, the claim that the method was switched to flatter the numbers. When statisticians reworked the 2022-23 accounts under the new system, the size of the Indian economy actually fell by about 3%, roughly Rs 7.7 trillion, according to the data platform Data for India.
Corporate India shrank on paper, with the measured value of big private firms dropping by nearly Rs 6.7 trillion. Household spending was revised down sharply, by about 4.3%. Only investment was marked up.
So the change did not inflate the economy’s picture. It made it leaner, and it quietly admitted that one part of the old story, how much ordinary families really spend, was overstated. The real argument is not “did they fake the base year?” It is whether the new method’s story of fast recent growth is built on solid assumptions.
The soft spot: the informal economy
The sharpest technical worry sits in the informal economy, the small shops, farms, tailors and workshops that still make up about 45% of India’s GDP and where, by one official count, most working women outside agriculture earn their living.
For years, statisticians had no reliable yearly data on these tiny businesses. So they did the next best thing: they guessed, assuming the informal sector grew at roughly the same pace as the big companies that were actually measured. If formal firms boom while small workers struggle, that guess makes the national total look better than it really is.
The 2026 series tries to end this guesswork. It now measures informal output every year using two fresh surveys, one of unregistered enterprises and one of the workforce. That is a genuine improvement, and it moves India closer to global best practice.
But notice what it means. The government has quietly accepted that the old method had a flaw. The debate is now over how big that flaw was, and how much of the past decade’s reported growth was an artefact of the guess.
A paper that rewrote two decades
The scholarly battle over exactly that question has a name. In March, a widely discussed working paper by Arvind Subramanian (a former chief economic adviser to India), Josh Felman and Abhishek Anand argued that India’s growth from 2011 to 2023 was overstated by roughly 1.5 to 2 percentage points a year. Real growth, they claim, was closer to 4 to 4.5% than the reported 6%. The boom years from 2005 to 2011 were, if anything, underestimated.
This is a contested claim, not a proven fact. Other economists have published rebuttals questioning the strength of its evidence. But the paper matters because of its method, not its headline. It digs into exactly the two places the whole debate turns: how the informal sector is estimated and how inflation is stripped out of the numbers. Those are the very things the new GDP system claims to have fixed.
Rajan asks what GDP cannot show
Raghuram Rajan’s argument is cleverer than “the number is fake.” His question: if India is genuinely growing this fast, why are good jobs not showing up?
The official job numbers are genuinely mixed.
Overall unemployment fell to 5.1% in July, helped by the villages. But the urban rate held near 6.7%. Joblessness among urban women actually rose to about 8.8%. Youth unemployment is roughly three times the national figure, the burden IndianYug traced when young Indians asked why hard work no longer pays. And only about 34% of Indian women are even in the workforce, a quiet verdict on whether growth is reaching half the country.
The wages story is just as tangled. Official surveys point to real wage growth averaging around 5.7% a year between 2020 and 2026. Yet a study by economists Arindam Das and Yoshifumi Usami, who examined official wage data from 2014-15 to 2022-23, finds that real wages for rural farm and daily workers stagnated, in some stretches growing under 1% a year. India can report healthy average wages and stagnant poor wages at the same time, because the strong earnings of the few pull the average up.
Rajan’s point is that India’s growth has become capital-intensive, driven by big firms, government construction and high-end services, and it does not spin off enough decent jobs for a young population. IndianYug has separately shown how parts of the celebrated startup economy rest on cheap and informal labour rather than secure work. None of that proves 7.8% is false. It asks what the number is really measuring.
The Tirupur paradox
Goyal’s answer, the plea for workers in Tirupur and his account of Larsen & Toubro unable to expand for lack of people, is offered as proof that the job crisis is imaginary. It is not a contradiction of Rajan. It is the other side of the same coin.
India can have high unemployment and labour shortages at the same time. The reasons are ordinary. A garment unit cannot use an engineering graduate. Wages in some jobs are too low to tempt people away from family work. Job seekers live hundreds of kilometres from the clusters that want them. And because few women are counted as job-seekers, the pool of available workers looks smaller than it truly is.
So Tirupur wanting hands does not refute the claim that India lacks enough good jobs. It illustrates it. The economy may want bodies, but workers want better terms. Both are true.
The test that will settle it
No single GDP number will end this fight. The honest test is to check the headline against signals that do not share its assumptions, and the early read points both ways.
On one side, the corroboration is strong: electricity use is up, industry is busier, cars are selling, services are humming, the government is investing. On the other side sit the warning lights: household consumption was revised down in the new series, rural and low-end wages have stagnated, and job quality remains thin even where jobs exist. Rural FMCG volume growth, roughly 5.3%, now matches urban growth, which is a hopeful sign for villages, but it follows years of a gap that Rajan says has not fully closed.
If GDP keeps racing while wages at the bottom, job quality and broad consumption lag, the honest question is not “is GDP fake?” It is “what exactly is GDP measuring, and who is it measuring for?”
Bottom line
Both sides are half right, and they keep talking past each other. The counting method genuinely improved, and it was not rigged to look bigger; the rebasing actually shrank the measured economy. But the deeper worries about how the informal sector and prices were handled for a decade are real, contested and unresolved.
So read the 7.8% as true. The evidence behind it is too broad, too many independent meters agree, for the headline to be a fiction. Do not yet read it as proof of shared prosperity. Real wages at the bottom have barely moved, broad consumption was revised down, and good jobs remain scarce. Treat the number as a ceiling on how much ordinary India is actually feeling, not as the whole story.
GDP will climb again next quarter, and the quarter after that. The figure that will tell you whether that climb is reaching your street is not on a government release. It is on a worker’s wage slip and a household’s grocery bill. That is the number India is still waiting to see move.
Sources
- MoSPI GDP estimates, Q1 FY27 (released August 31, 2026)
- Economic Times analysis of Q1 high-frequency indicators (2026)
- PIB FAQs, 2022-23 base year revision and informal sector methodology
- Data for India, “How India’s GDP adds up” (July 2026)
- Anand, Felman and Subramanian, Peterson Institute Working Paper 26-3 (March 2026)
- Business Today and CNBC-TV18, Piyush Goyal remarks (September 2026)
- Coverage of Raghuram Rajan’s comments on GDP and jobs (September 2026)
- MoSPI PLFS Monthly Bulletin, July 2026
- NIQ and industry data on FMCG volume growth, Q1 2026
- Das and Usami, rural wage trends 2014-15 to 2022-23 (as reported in The New Indian Express, 2026)